
Our cheat sheet provides spectrogram examples of birds present in New Zealand, and examples of other environmental sounds that are found in automated field recordings. We find them helpful when looking at calls. Please note that there is a large variation between the appearance of calls even within a species, so while we’ve tried to show several examples, we will have missed things.
A spectrogram is a visual representation of sound. It shows the amount of energy (using colour) in different frequency bands (vertical axis) against time (horizontal axis). In the spectrogram below – which shows a female and male kiwi duet – the whiter the colour, the more energy there is in that band. So you can see that the female (who calls first) has a lower-pitched call because the white parts are lower down in the picture. With practice you recognise the signatures of different species, but there are always some that you need to check. That’s what this cheat sheet is for.

Sound is continuous. To turn it into a digital signal that a computer can use, we sample the continuous (analogue) signal lots of times per second. The sampling frequency is how often this happened inside the acoustic recorder. A common number 16,000 samples per second, which is written as 16,000 Hz or 16 kHz (1 Hertz is once per second). The highest frequency that we can represent is the Nyquist frequency, which is the sample rate divided by two. So if you record at 16 kHz, you will actually be able to see the sounds up to 8 kHz, as in the spectrogram above. So if you wish to record high-pitched birds, you will need to use higher sampling rates.
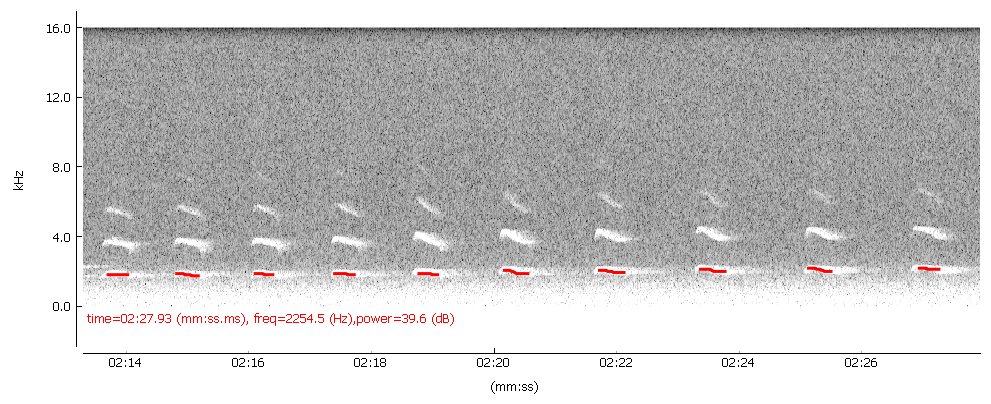
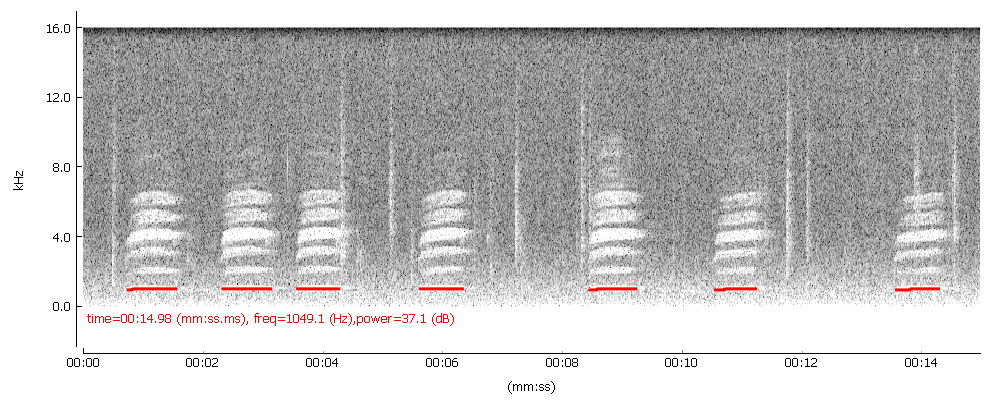
If you look at the spectrograms below, you can see that there is energy in several frequency bands (three or four in the picture on the left, and more in the picture on the right). The main frequency is the lowest, also called the fundamental frequency. It’s normally the one where the most energy is. The others are frequencies that have a particular mathematical relationship with the fundamental (integer multiples of it). As they are higher-pitched, and have less energy in, they decay (attenuate) more quickly with distance, which is why the number of them changes in different spectrograms. They tell you something about the distance of the bird from the microphone, the direction the bird was facing in, and the environmental factors, such as wind and terrain, but unfortunately it’s not usually possible to tell which effects are causing the change. AviaNZ has the option to identify the fundamental frequency; we’ve plotted them as red lines on the spectrograms below.
 |
 |
|
| NI brown kiwi (male) | Morepork (trill sound) |
The sound files we have used for the cheat sheet come from a few different sources. We've tried to label their sources correctly, but if there are problems, please let us know. The main one is New Zealand Birds Online (http://nzbirdsonline.org.nz); thanks to Colin Miskelly for agreeing to let us use them. These sound files were all in MP3 format, so they don't make the prettiest spectrograms. Other sounds files came from the Department of Conservation, thanks to James Mortimer for supplying those, and some come from our own recordings.
| Birds | Other Sounds |